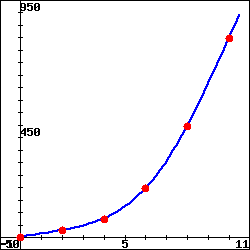
A car is timed going down a track. Table 1 shows the distance the car is from the start line after it initially takes off. Table 2 shows the distance
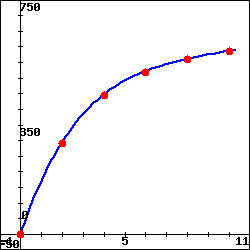
the car is from the finish line after it crosses the line and eventually comes to a stop.
| | Table 1 |
| Time (s) | Distance (ft) |
| 0 | 0 |
| 2 | 28 |
| 4 | 74 |
| 6 | 195 |
| 8 | 444 |
| 10 | 795 |
| |
| | Table 2 |
| Time (s) | Distance (ft) |
| 0 | 0 |
| 2 | 292 |
| 4 | 445 |
| 6 | 519 |
| 8 | 559 |
| 10 | 585 |
|
Note: Click on any graph to view a larger graph.
1) From Table 1, calculate the average speed between and :
2) From Table 1, calculate the average speed between and :
3) From Table 1, calculate the average speed between and :
4) From Table 2, calculate the average speed between and :
5) From Table 2, calculate the average speed between and :
6) From Table 2, calculate the average speed between and :
7) Describe the behavior of the function in Table 1:
8) Describe the behavior of the function in Table 2:
You can earn partial credit on this problem.