| |
Suppose .
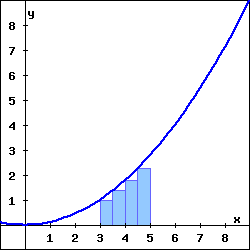
(a) The rectangles in the graph on the left illustrate a left endpoint Riemann sum for on the interval . The value of this left endpoint Riemann sum is , and it is an
the area of the region enclosed by , the x-axis, and the vertical lines and .
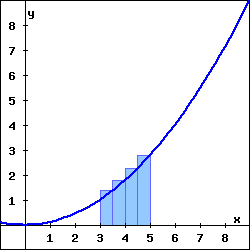
(b) The rectangles in the graph on the right illustrate a right endpoint Riemann sum for on the interval . The value of this right endpoint Riemann sum is , and it is an
the area of the region enclosed by , the x-axis, and the vertical lines and .
| |
 |
|
 |
|
|
Left endpoint Riemann sum |
|
Right endpoint Riemann sum |
|