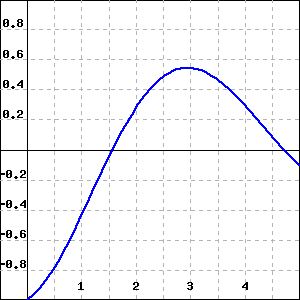
Using your graph, at what -values is ?
Give your answer as a list of -values to the nearest 0.25, or enter none if is never equal to -0.75.
Graph of