| |
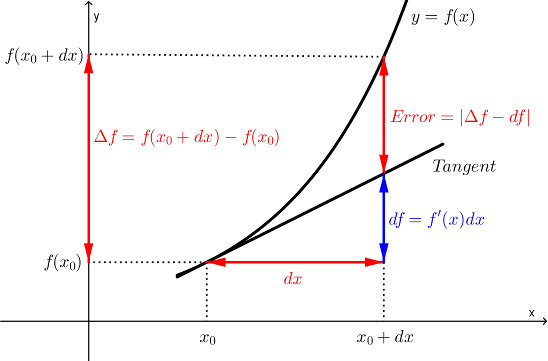
The figure shows how a function
and its linear approximation (i.e., its tangent line) change value
when changes from
to .
Suppose , and
. Your answers below need to
be very precise, so use many decimal places.
(a) Find the change .
=
(b) Find the estimate (i.e., the differential) .
=
(c) Find the approximation error .
Error =
| |
 (Click on graph to enlarge) |