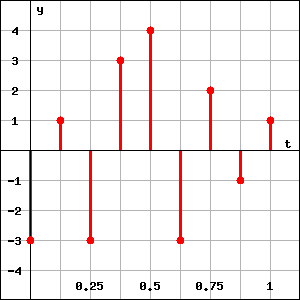
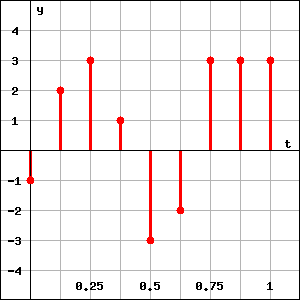
Consider the two discrete time signals and graphed below and each sampled 8 times per second for .
 |
|
 |
|
|
Graph of |
|
Graph of |
- Find the coordinate vector representations for the discrete time signals and .
- Draw the vector sum as a discrete time signal. Then, verify your answer using vector addition operations.
- Draw the scaled vector as a discrete time signal. Then, verify your answer using vector addition operations.
- Find the vector sum when and .
- Find the additive inverse of .
You can earn partial credit on this problem.