| |
A graph of is given in the figure.
(a) What is the initial value of (when )?
help (numbers)
(b) This quantity decays at a continuous rate of
% help (numbers)
(c) Use the graph to estimate the value of when .
help (numbers)
(d) Use logs to find the exact value of when .
help (logarithms)
| |
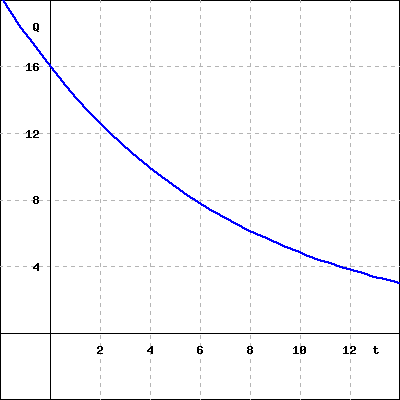
(Click on graph to enlarge)
|