Corn production, , is a function
of rainfall, (in inches), and temperature,
(in degrees C).
The first figure below shows how rainfall is predicted
to vary with time because of global warming; the second,
how temperature is predicted to vary with time because of
global warming.
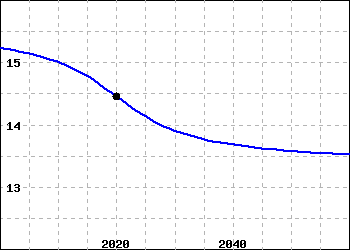
Graph of rainfall, vs. time,
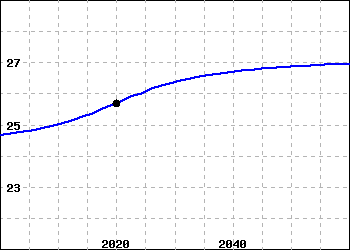
Graph of temperature, vs. time,
Suppose that we know that (currently)
Use this to estimate the change in corn production between the year
2020 and the year 2021.
Change =
Hence, estimate when .
You can earn partial credit on this problem.