The figure below shows cost (blue) and revenue (black)
functions over the domain (in thousands of units).
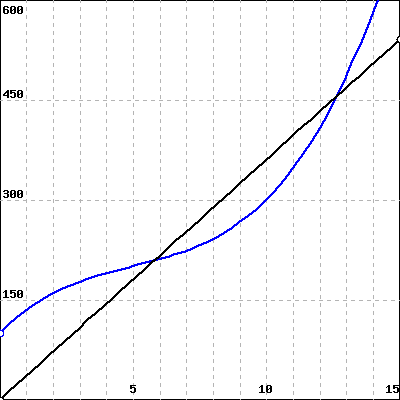 (Click on the graph to get a larger version.)
For what production levels is the profit function
positive?
(Give your answer as an interval or a list of intervals,
e.g., (-infinity,8] or
(1,5),(7,10) .)
For what production levels is the profit function
negative?
(Give your answer as an interval or a list of intervals,
e.g., (-infinity,8] or
(1,5),(7,10) .)
Estimate the production at which profit is maximized.
thousands of units.
You can earn partial credit on this problem.