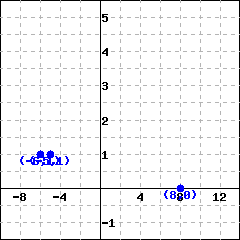
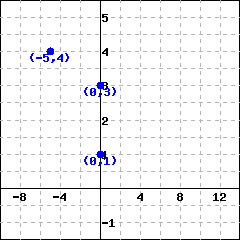
The following graphs show two relationships.
If you would like to enlarge the graph or make numbers and letters easier to read, you may click on it to open it in a new window. You may then enlarge that window with your mouse. To further enlarge the image, use your browser’s zoom capabilities. On a PC this is usually
ctrl shift + (and zooming out is
ctrl -). On an Apple computer this is usually
apple shift + (and zooming out is
apple -).
Decide whether each graph shows a relationship where is a function of .
Does the relationship in Graph 1 show as a function of ?
Graph 1

Does the relationship in Graph 2 show as a function of ?
Graph 2

You can earn partial credit on this problem.