For each residual plot below, decide on whether
the usual assumptions:
" independent N(0,) random variables"
of simple linear regression are valid or not.
If some assumptions seem invalid, choose the options(s) which indicate
the most obvious departures from the model assumptions.
Note : For a small sample, the normality assumption cannot
be "proved", but it can be "violated" if there is an extreme
residual (outlier).
Part a)
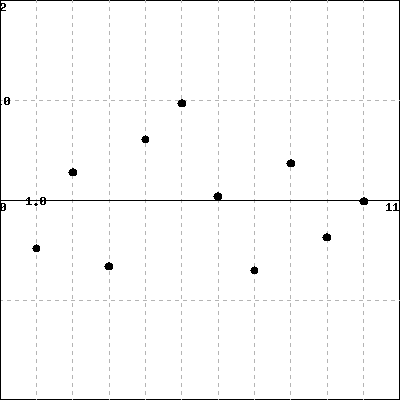
y-axis has residual, x-axis has x-variable with values 1,2,...,10.
(Click on graph to enlarge)
Which is/are the best answer(s) for the residual plot (a)?
Part b)
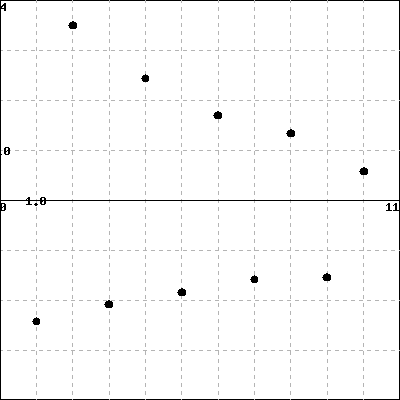
y-axis has residual, x-axis has x-variable with values 1,2,...,10.
(Click on graph to enlarge)
Which is/are the best answer(s) for the residual plot (b)?
Part c)

y-axis has residual, x-axis has x-variable with values 1,2,...,10.
(Click on graph to enlarge)
Which is/are the best answer(s) for the residual plot (c)?
Hint:
You can earn partial credit on this problem.