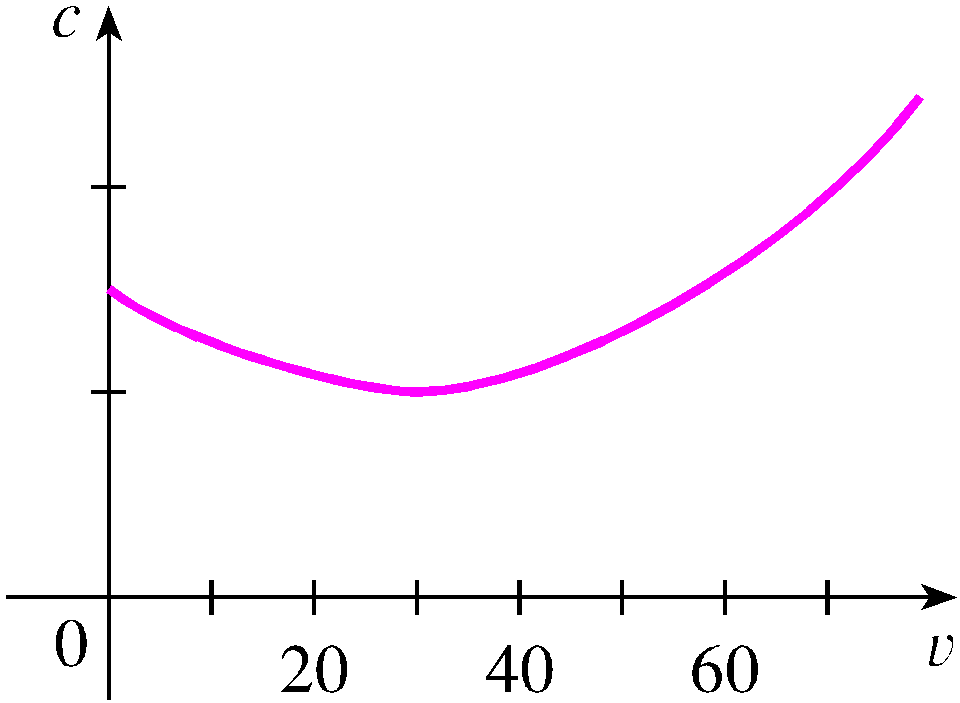
The graph shows the fuel consumption c of a car (measured in
gallons per hour) as a function of the speed v of the car. At
very low speeds the engine runs inefficiently, so initially c
decreases as the speed increases. But at high speeds the fuel
consumption increases. You can see that c(v) is minimized for
this car when v is about 30 mi/h. However, for fuel
efficiency, what must be minimized is not the consumption in
gallons per hour but rather the fuel consumption in gallons
per mile. Let's call this consumption G. Using the graph,
estimate the speed at which G has its minimum value.

mi/h