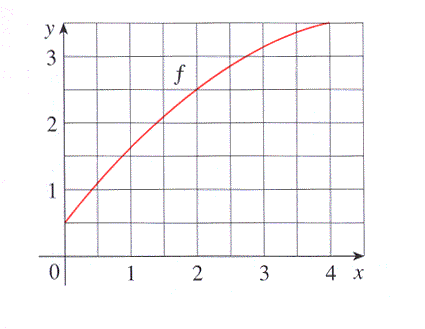
Let where is the function whose graph is shown below.
(a) Use the graph to find and
(b) Are these underestimates or underestimates ?
1.
2.
3.
(c) Use the graph to find
(d) Is an overestimate or underestimate of ?
1.
(e) For any value of , list the numbers and in increasing order. For each of the five values, order them from 1 to 5, with 1 indicating the smallest of the five values and 5 being the largest of the values.
1.
2.
3.
4.
5.

You can earn partial credit on this problem.