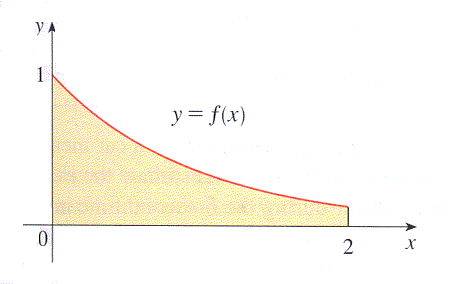
The left, right, Trapezoidal, and Midpoint Rule approximations were used to estimate where is the function whose graph is shown below. The estimates were 0.7811, 0.8675, 0.8632, and 0.9540, and the same number of subintervals were used in each case.
(a) Which rule produced which estimate?
1. Midpoint Rule estimate
2. Trapezoidal Rule estimate
3. Right-hand estimate
4. Left-hand estimate
(b) Between which two approximations does the true value of lie?

You can earn partial credit on this problem.