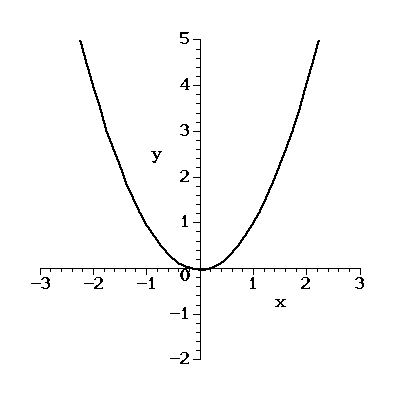
Consider the function Its graph is the standard parabola shown
in this Figure:

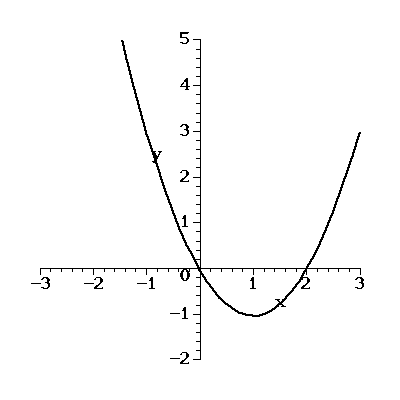
The graph in this Figure

has been obtained by shifting the first graph one unit to the right,
and one unit down. (Don't get confused by the fact that the scales on
the two axes are different.) It is the graph of the function
Hint:
Ask what happens to the vertex of the graph.