The diagram below shows the graph of a function along with points and ,
which lie on the graph. Point is chosen so that is a right
triangle. (Click on the graph to display a larger version.)
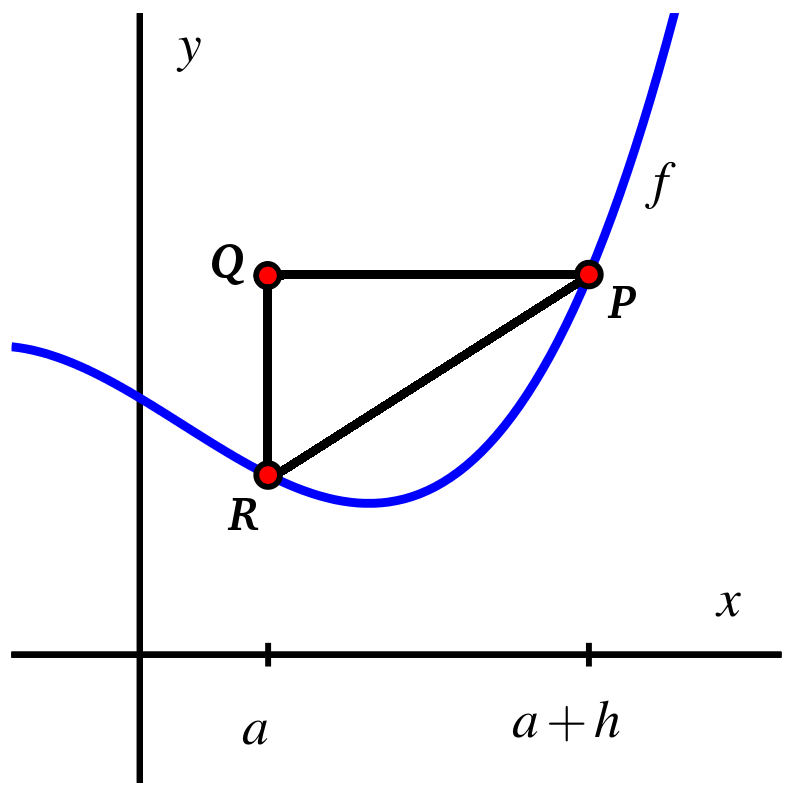
Give a formula, in terms of , , and , for the slope of the line through points
and .
Slope =
.